
What Marketers Should Do
One Social Post Can Tell Two Different Performance Stories
A post goes up, the numbers arrive; sometimes they agree- it’s easy when that happens, you nod, and you move on, but sometimes they split: the reel does numbers on the app, quiet as a library on Google, or the opposite: a post nobody liked, drifting through search like it owns the place.
Until recently, nobody could digest that contradiction, because there was no real data to contradict it; there existed platform analytics for what happened on the platform, nothing for what happened when someone typed a couple of words into Google and your content responded back.
Everything changed in July 2026, when Google folded platform properties into Search Console, a property type that lets you verify an Instagram, TikTok, X, or YouTube account to see how that specific content performs in Google Search, Discover, and Google News, no website required. Global availability and an analysis guide followed later that month.
This isn’t a piece about the announcement; it’s about what happens the first time your Search Console numbers and your app numbers refuse to see eye to eye, and why that disagreement is the most useful thing either of them will tell you.
Social and Google Search Are Measuring Different Things
Here’s the easy mistake: treating social engagement and Google Search performance as two readings of the same instrument, because both live in a dashboard and both go up and down.
They’re not the same instrument.
Native social metrics reach, views, saves, shares measure how a recommendation engine chose to distribute your content to people who weren’t necessarily looking for it. Google Search measures something closer to the opposite: a person typed words, meant something by them, and your content was judged the best available answer. One system pushes content outward. The other responds to a question already in someone’s mouth so rank tracking becomes essential.
That distinction is also why social performance rarely tells the whole search story. A broader search strategy looks at how demand shows up across queries, landing pages, content gaps, and search visibility, not just how a post performs inside the platform where it was published.
When that analysis needs deeper expertise, professional SEO services can help turn those signals into a more structured search strategy.
A post can win at being pushed and lose at being asked for or the reverse and neither result cancels the other out. They’re just not measuring the same appetite. Google’s own guide to analyzing social and video content in Search Console frames the two data sets this way too: complementary lenses, not competing scores.
Normalize Performance Before You Compare It
Don’t compare a TikTok view count to a Google impression count, not the same unit of anything. What you compare is a post against itself, against what’s normal for that account.
Take a handful of recent, broadly comparable posts, same platform, similar format and topic, roughly the same window, similar account conditions. That’s your baseline. Not perfect science. A fair fight.
Then ask two questions about the new post, separately:
- Is its native performance above or below that account’s normal?
- Is its Google Search performance above or below that account’s normal?
Two questions, four combinations. That’s the whole matrix.
One rule worth nailing to the wall before going further: don’t change strategy off one post. Look for the same pattern across at least five broadly comparable posts, spread over several weeks, before treating it as more than a fluke. Five isn’t a statistically validated number nobody ran a study, it’s a practical floor against mistaking one loud data point for a trend.
The Four Performance Patterns Worth Investigating
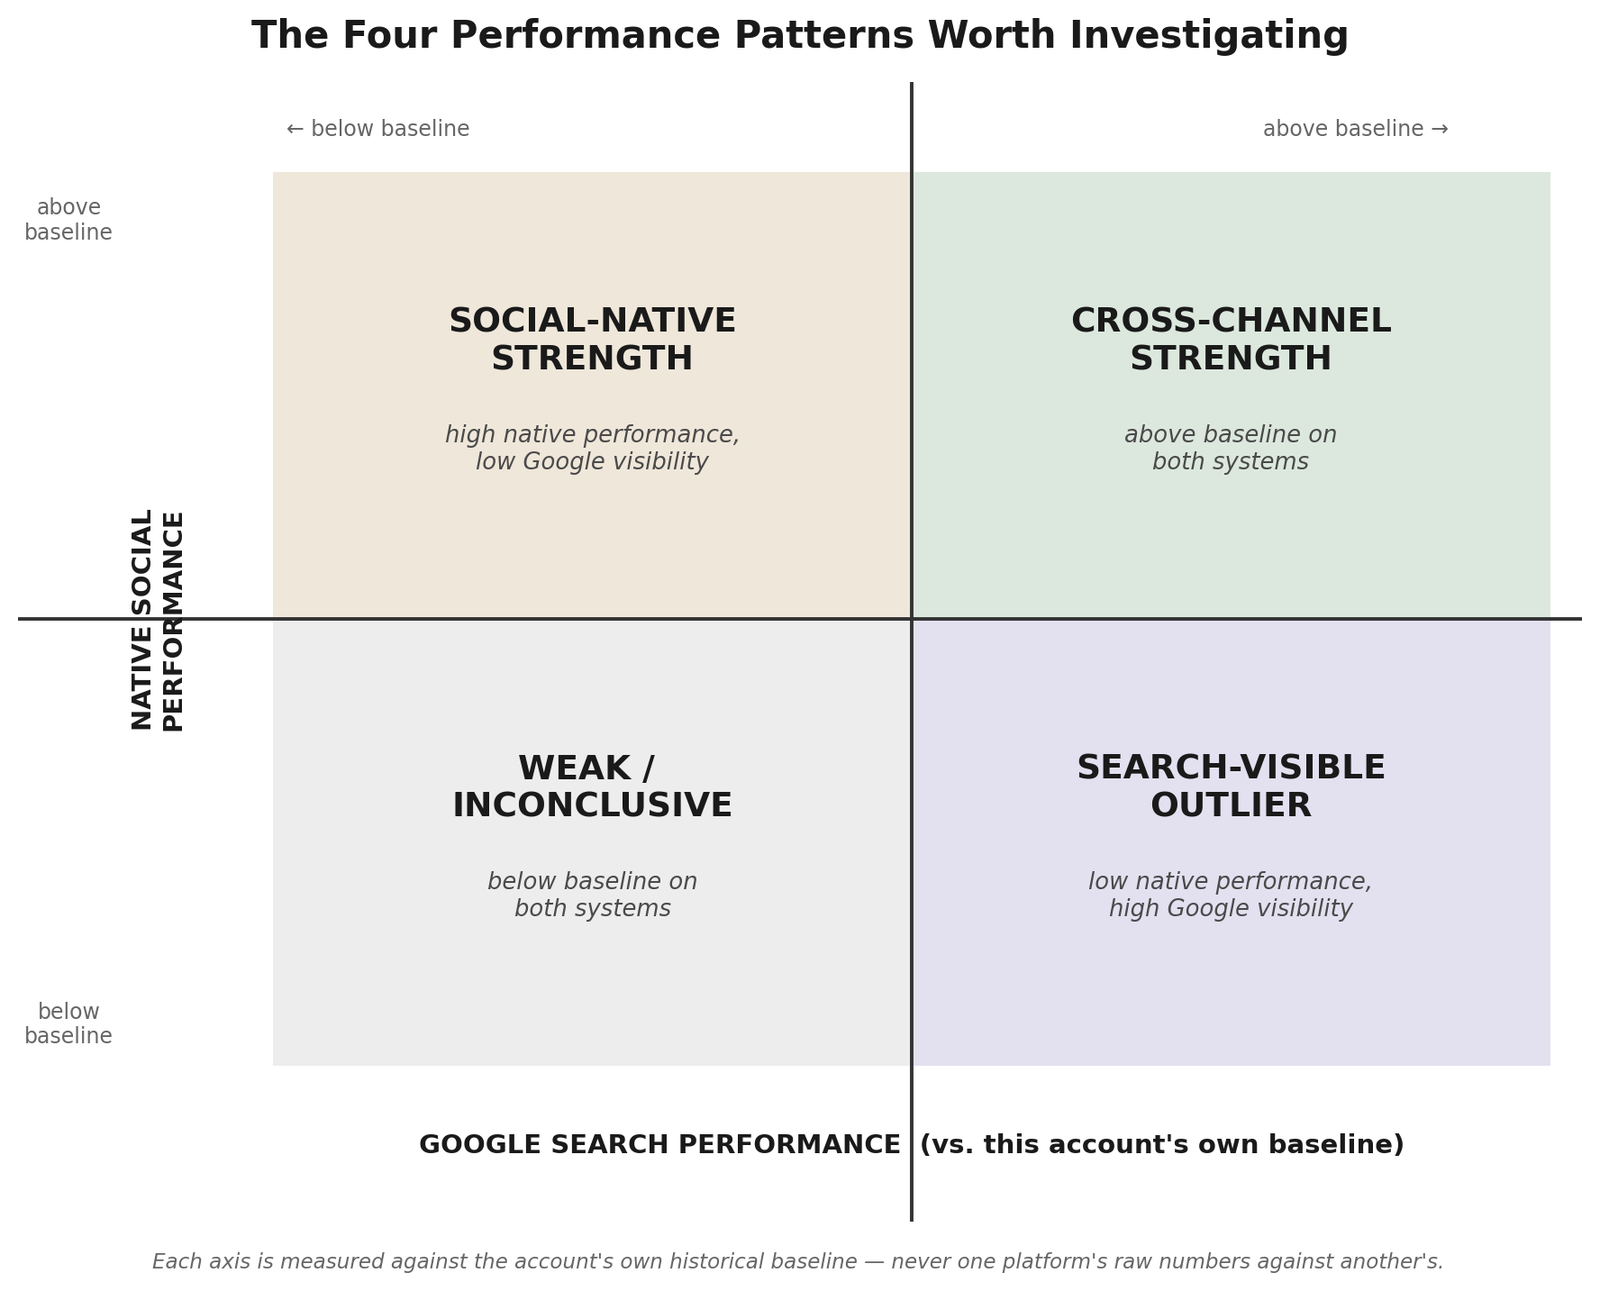
Put the two questions on two axes and you get four rooms a post can end up living in.
Above / Above — cross-channel strength. The recommendation engines like it and the search demand is there too. Worth a longer look at whether it deserves a bigger stage: repurposing, cross-promotion, a companion piece.
Above native / below Google — social-native strength. It’s doing exactly what it was built for, inside the room it was built for. That’s not a failure to rank, some content is a conversation, not an answer to a question anyone’s typing.
Below native / above Google — search-visible outlier. The quiet one. Underperformed inside the app, and yet Google keeps surfacing it to people who went looking, this is the room that tempts people to shout “hidden opportunity” to resist that. It’s not an opportunity yet. A lead, nothing more.
Below / below — weak or inconclusive. Neither system cares, could mean the topic’s dead, could mean there’s not enough data yet to know anything, don’t force a verdict out of silence.
What the Framework Looks Like in Practice
Say an account’s typical comparable post pulls 5,000 native reach and 240 Google impressions. Two new posts come in.
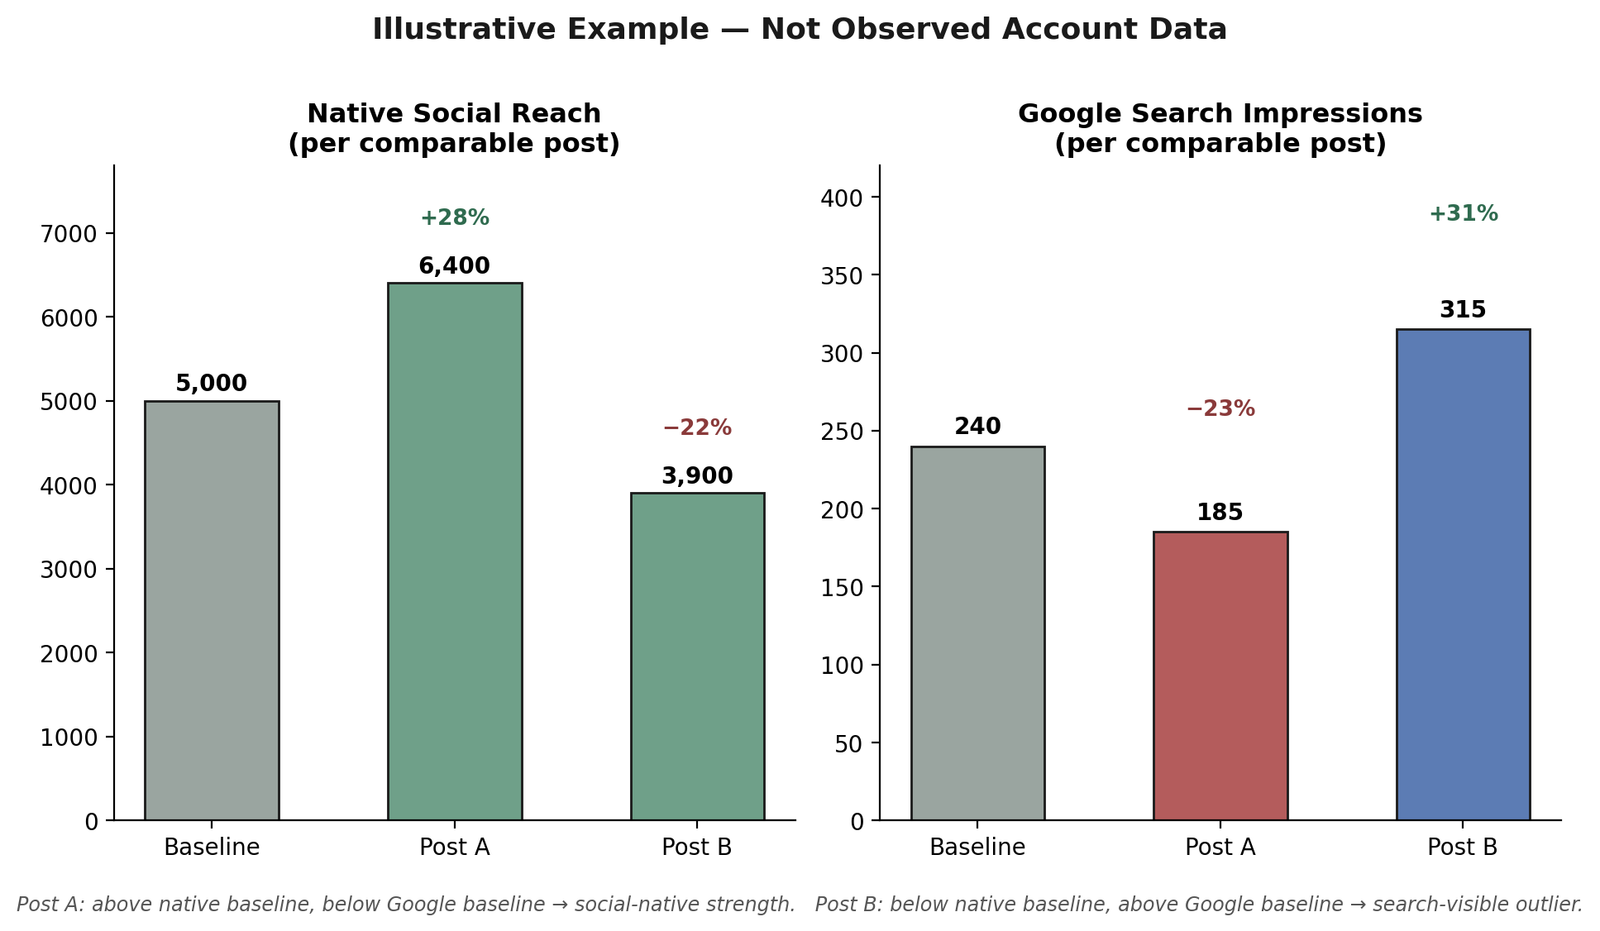
Post A pulls 6,400 native reach (up 28%) and 185 Google impressions (down 23%). Above native baseline, below Google baseline, social-native strength.
Post B pulls 3,900 native reach (down 22%) and 315 Google impressions (up 31%). Below native baseline, above Google baseline search-visible outlier.
Neither number is dramatic. That’s deliberate most real posts won’t hand you a wild swing that explains itself. Most look like Post A and B, a shrug in one direction and a nudge in the other, and the job is figuring out whether the shrug means anything.
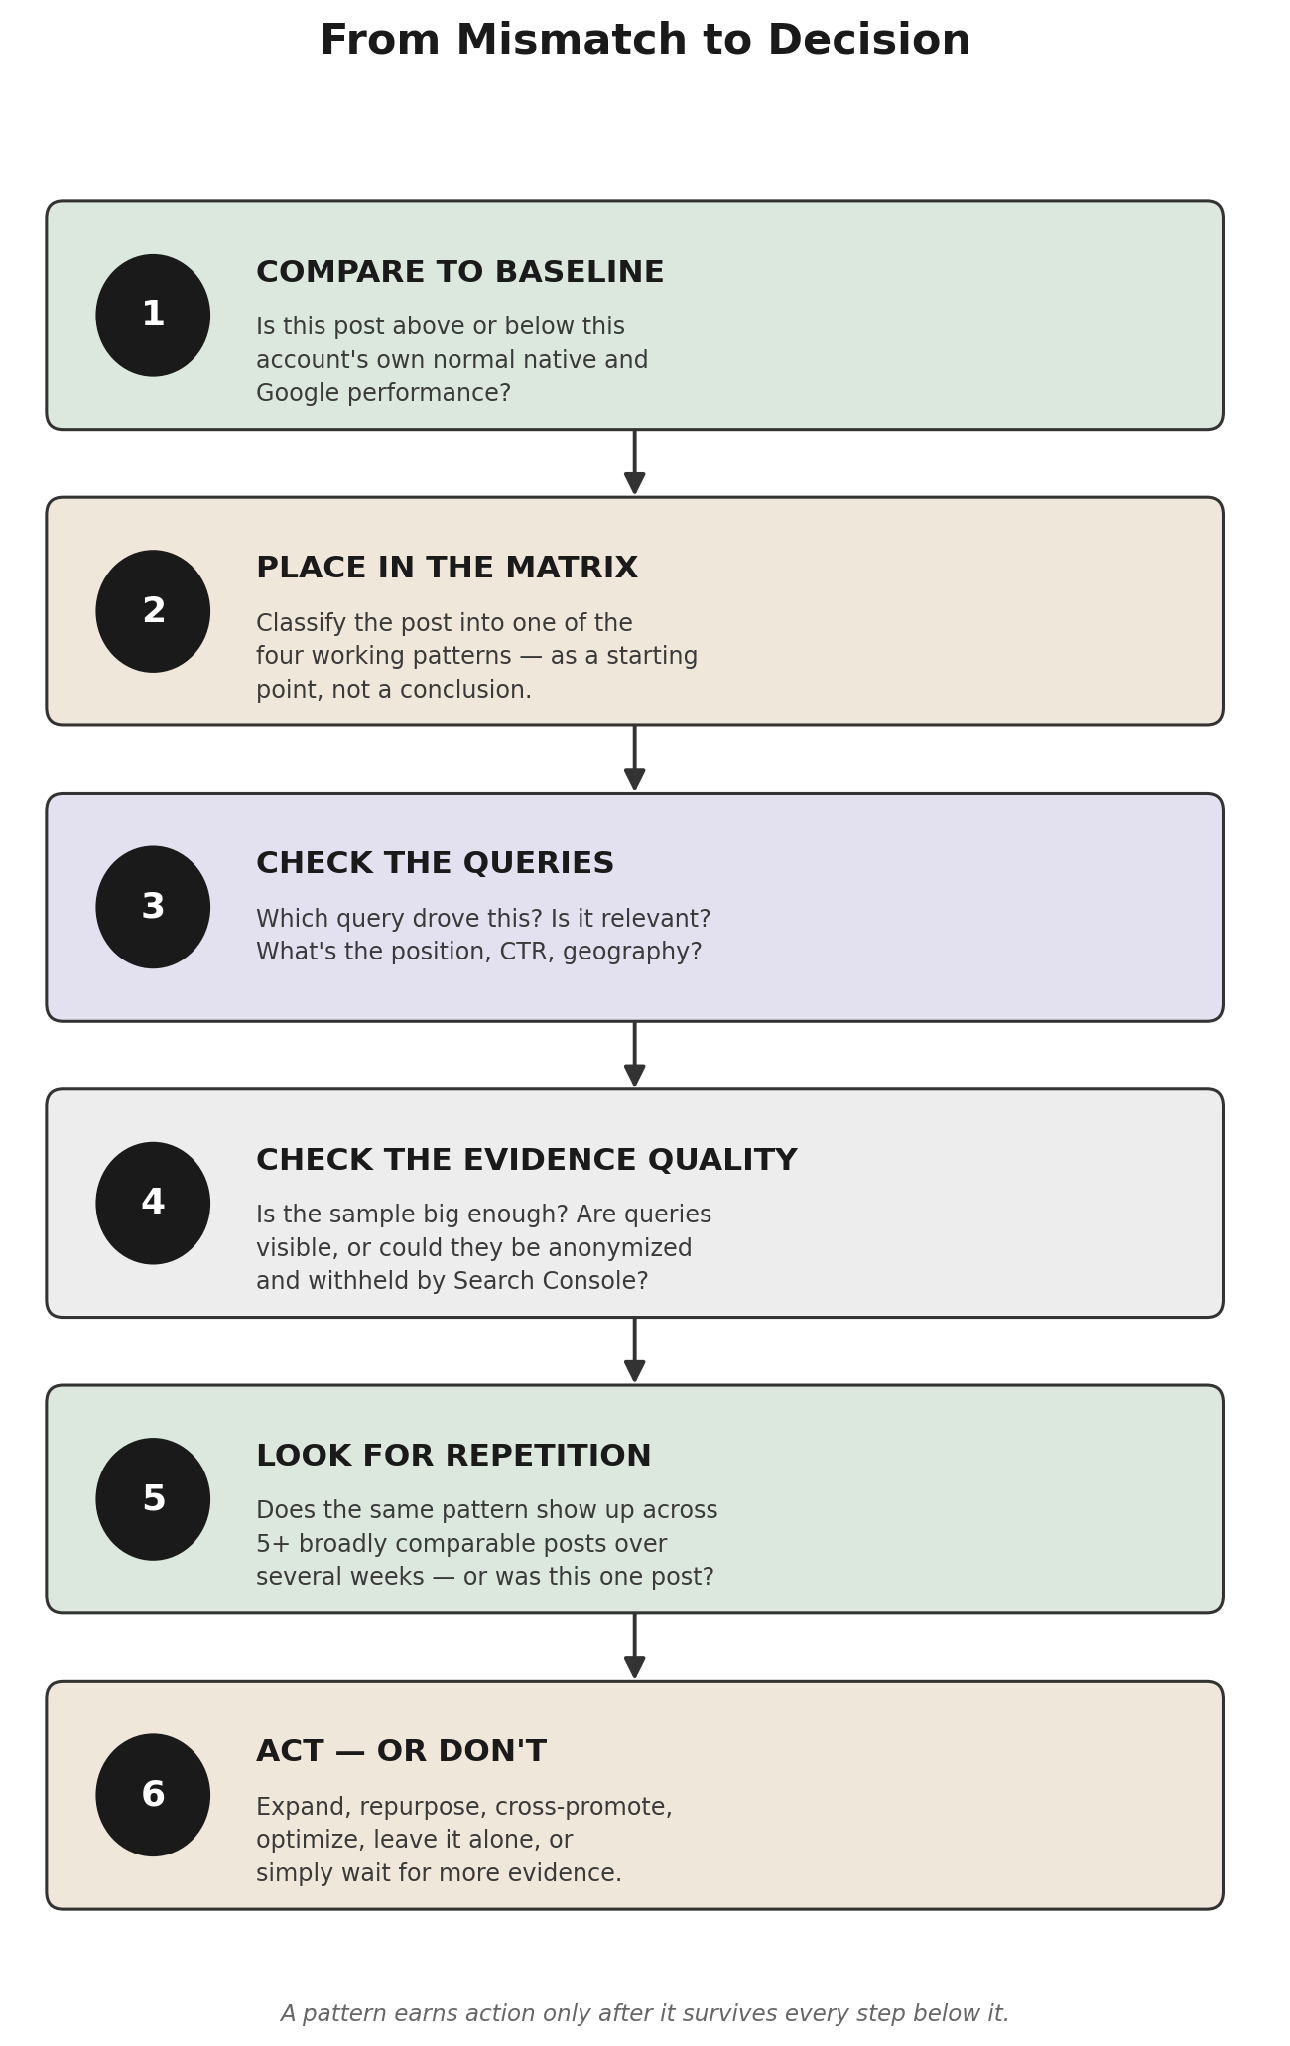
Don’t stop at the label. That’s step two of six.
Check the Queries Before You Decide What the Pattern Means
A quadrant is a hypothesis, not a finding. Before acting on Post B as a search-visible outlier, go back into the data and ask it harder questions:
- Which query actually drove the visibility, and does it have anything to do with what the post is about?
- Where does it sit — average position, click-through rate? High impressions with a buried position and no clicks is a different animal than a post genuinely winning attention.
- What geography — your audience, or noise from somewhere the content has no relevance to?
- How old is the post, and is Google even done deciding what to do with it?
A quadrant with no query behind it is a guess wearing a nice outfit.
Small Samples Create Noise and Search Console Can Hide Queries
Two separate problems get lumped together under “the data’s too small to trust,” and they deserve to be pulled apart.
The first is plain statistical noise. Four impressions becoming eight looks like a post’s on fire, a 100% jump on paper, and means almost nothing in practice. Small numbers swing hard for reasons that have nothing to do with your content getting better or worse.
The second is quieter and stranger: some query data is never shown to you at all. Google’s own documentation on Search Console’s data filtering states that queries issued by no more than a few dozen users over a two to three month window are withheld from the query tables to protect user privacy, even though they still count toward the overall totals in the charts.
Put those two together and you get something worth sitting with: impressions can rise, clicks can rise, and the table meant to explain why can be structurally incapable of telling you. That’s not the Search Console broken.
That’s Search Console doing exactly what it’s built to do — and the honest response is lower confidence, not higher certainty. Add in that the Insights report defaults to a 28-day window, and it’s clear: widen the date range in Performance, or export the data, before drawing a line through anything.
When the Signal Is Strong Enough, Decide What to Do
If the pattern has survived the baseline check, the quadrant, the query inspection, and repeated across five or more comparable posts over several weeks, now you’ve earned an opinion. What you do depends on which room the post lives in.
Cross-channel strength — build on it. Expand the topic, cross-promote to another platform, give it a companion piece.
Social-native strength — leave it where it thrives, unless the query check turns up a relevant, repeatable term worth testing separately. Don’t force an SEO angle onto something that was never trying to be found, just watched.
Search-visible outlier, confirmed — here’s where it gets interesting. A topic that keeps surfacing in Google despite modest native performance may deserve more coverage than a caption can hold: a longer video, an FAQ, an actual page built to answer what people are typing.
This is usually where a social team hits a wall that isn’t theirs to fix the website has nowhere to send that demand. That’s a content-architecture problem, worth a conversation with whoever handles SEO strategy for the site, not another social post.
Weak or inconclusive — do less, not more. Wait for better evidence. Resist manufacturing a story out of silence.
The Mismatch Is a Clue, Not a Verdict
Nobody needs another article announcing that social and search are converging. That’s been said, and said again, since the day this feature shipped.
What’s actually useful is smaller and harder: a disagreement between how content performs inside an app and how it performs inside a search bar isn’t a contradiction to resolve. It’s two rooms giving you two honest, partial reports on the same thing neither built to tell you the whole truth alone.
Treat the gap the way you’d treat any lead worth following: curiosity first, conclusions last. Check the baseline. Check the quadrant. Check the query. Check whether the sample’s even big enough to trust. Wait for the pattern to repeat before spending a dollar or a headline on it.
The post did not fail. The post did not win. The post is asking a question. Answer it before you decide what it meant.